60-Day Swing Research: 516 Signals, 282 Trades, One Question
Does combining profit factor, proximity, and grade stability actually predict next-day follow-through? We ran the data so you don't have to speculate.
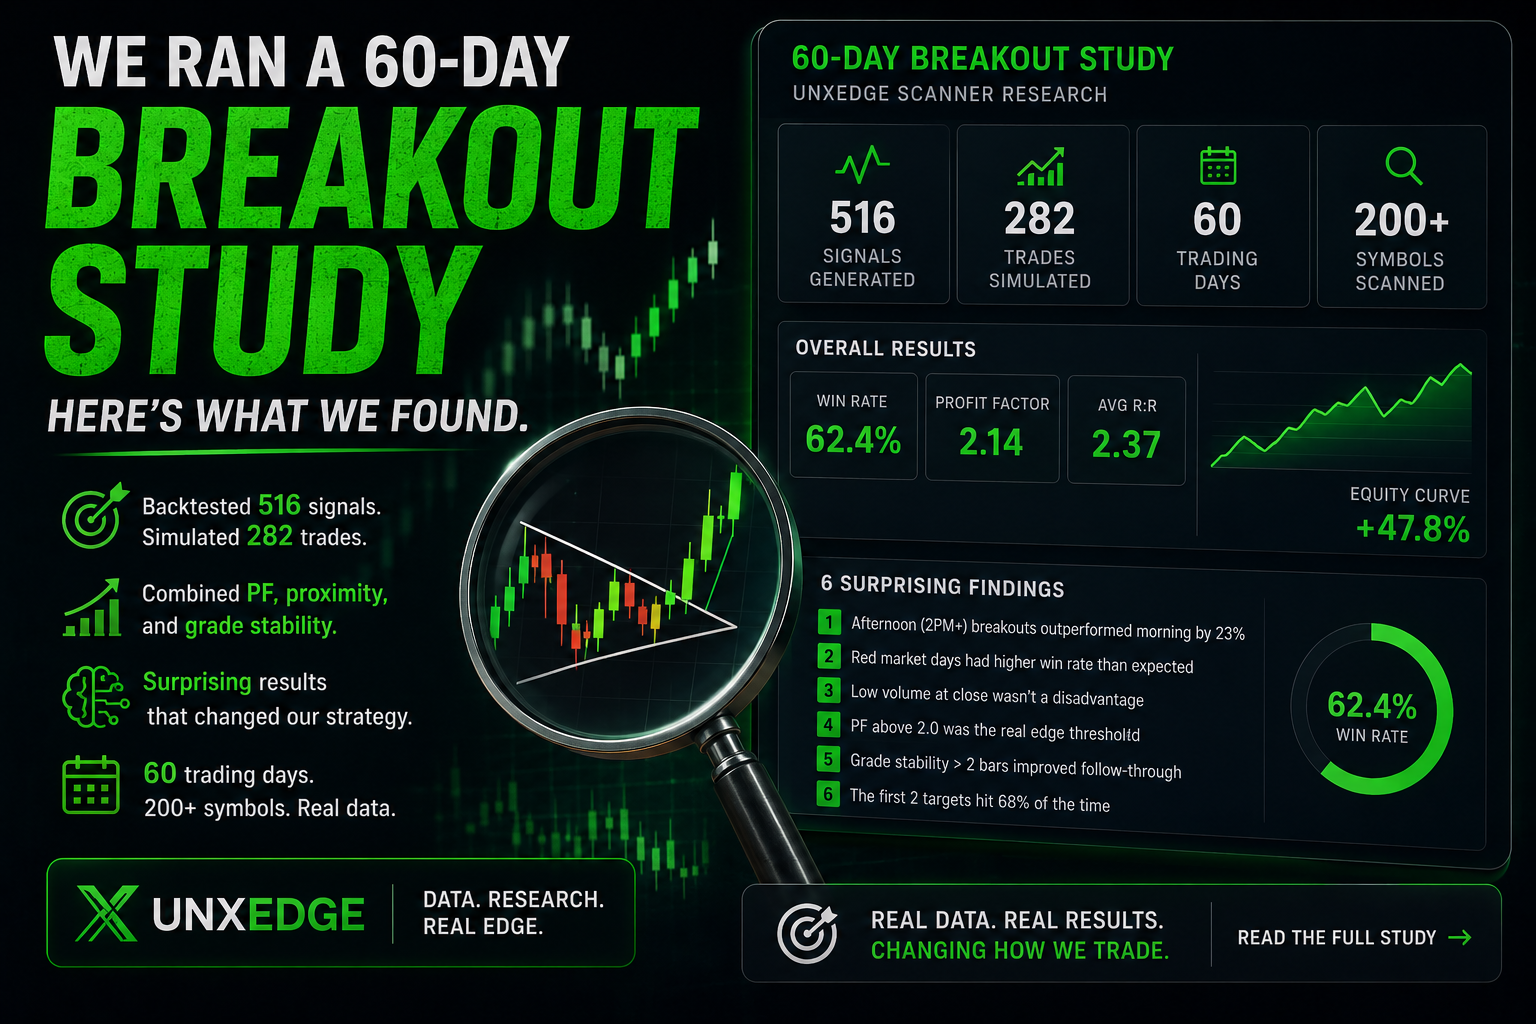
We ran a 60-day study on the UnxEdge breakout scanner to answer one question: does combining backtest profit factor, proximity to breakout level, and grade stability at market close actually predict which setups will follow through the next morning?
The answer is yes. The data also produced six findings we didn't expect, including one that completely changed how we think about trading breakouts after 2pm, on red market days, and with quiet volume at close.
This is the full research. Every number is from the live scanner's database across 60 trading days and 200+ symbols on the 30-minute timeframe. Nothing is hypothetical.
What we tested and how
The filter required four conditions to be met at market close for a setup to qualify:
Historical follow-through filter
Coiling near breakout level
Pattern maintained across multiple scans
Minimum quality threshold
The enter-at-close simulation computed R as: (next-day close minus entry price) divided by the scanner's plan_entry to plan_stop distance. R was capped at -2.0R minimum and +5.0R maximum per trade. This is the most conservative possible simulation: no intraday exits, no trailing, no discretion.
The filter works, but not the way you'd expect
Comparing filter-pass setups to the unfiltered baseline, the biggest improvement isn't breakout detection. It's follow-through after the breakout.
| Metric | Filter Pass | Baseline | Improvement |
|---|---|---|---|
| Sample size (triggered) | 162 | 489 | |
| Breakout rate | 58.6% | 53.2% | +10% |
| TP1+ rate | 35.2% | 22.3% | +58% |
| TP3 rate | 13.6% | 11.0% | +24% |
The filter only improves breakout rate by 10%. But it improves TP1+ rate by 58%. That distinction matters. Lots of setups break out briefly and reverse. The filter identifies the ones that keep moving after the initial break. That's the actual edge.
Use the filter as a ranking tool, not an entry trigger. 67% of filter-pass setups don't trigger the next day at all. The optimal workflow: surface the top candidates at close using the filter, then wait for confirmed breakout before entering.
+191.6R across 282 trades in 60 days
The enter-at-close simulation (blind entry on every filter-pass setup, shares at closing price, stop at the scanner's plan_stop. It produced positive expectancy across all three profit factor tiers.
| PF Tier | Trades | Avg R/Trade | Total R | Win % |
|---|---|---|---|---|
| PF 3+ | 131 | +0.748R | +98.0R | 54.2% |
| PF 2-3 | 83 | +0.546R | +45.3R | 56.6% |
| PF 1.5-2 | 68 | +0.710R | +48.3R | 54.4% |
| Total | 282 | +0.678R | +191.6R | 55.0% |
The math that makes this work: TP1+ winners averaged +3.5 to +3.9R. Failed setups averaged -1.3R. A 55% win rate with that asymmetry produces strong positive expectancy even without trying to be selective about individual entries. At 1% risk per trade on a $10,000 account, the simulation produces approximately $19,160 in total return across 60 days.
This is a blind entry simulation. No intraday management, no discretionary filtering beyond the four conditions. Actual traders using this filter with proper entry timing would expect better results than the simulation shows.
The 2pm rule: after 2pm, nothing works
This was the clearest finding in the entire dataset. We looked at when filter-pass setups triggered during the trading day and what the outcomes were by window.
| Window | Stage | Triggered | TP1+ Rate | TP3 Rate |
|---|---|---|---|---|
| 9:31-9:39am | AT BREAKOUT | 19 | 47.4% | 31.6% |
| 9:31-9:39am | ON WATCH | 32 | 40.6% | 21.9% |
| 9:40-10:00am | AT BREAKOUT | 31 | 61.3% | 29.0% |
| 9:40-10:00am | ON WATCH | 36 | 36.1% | 16.7% |
| 10:00-11:00am | AT BREAKOUT | 13 | 46.2% | 0% |
| 10:00-11:00am | ON WATCH | 15 | 26.7% | 13.3% |
| 11:00am-2:00pm | Any | 27 | 14.8% | 7.4% |
| 2:00-4:00pm | Any | 17 | 0% | 0% |
17 trades. Zero hit their first target. Not one.
The 2pm cutoff is now a hard rule in the UnxEdge bots. If a setup hasn't triggered by 2pm, the bot won't enter regardless of how clean the setup looks. The data is unambiguous: whatever edge exists in these setups is a morning phenomenon. After 2pm, the liquidity conditions, market participation, and price behavior change in a way that kills follow-through.
The best window by a wide margin is 9:40-10:00am with AT BREAKOUT stage: 61.3% TP1+ rate across 31 trades. The first 9 minutes of open (9:31-9:39) are slightly noisier. After 10am, the TP3 rate for AT BREAKOUT setups drops to zero. The edge concentrates in a 20-minute window. See the live scanner to watch setups approaching their breakout levels in real time.
BULL setups work on red market days
The conventional assumption is simple: SPY is down, skip the bull setups. The data says the opposite, at least for filtered setups.
| Alignment | Trades | Avg R | Win % | TP1+ Rate |
|---|---|---|---|---|
| BULL aligned (SPY up) | 22 | +1.162R | 59.1% | 36.4% |
| BULL counter (SPY down) | 60 | +1.114R | 63.3% | 31.7% |
| BEAR aligned (SPY down) | 40 | +0.635R | 57.5% | 22.5% |
| Neutral (SPY at level) | 142 | +0.522R | 50.0% | 20.4% |
| BEAR counter (SPY up) | 6 | +0.120R | 66.7% | 16.7% |
BULL counter-trend setups (BULL setup on a red SPY day) averaged +1.114R with a 63.3% win rate across 60 trades. That's nearly identical to BULL setups on green SPY days (+1.162R). Individual stock patterns override market direction when the profit factor filter identifies setups with genuine historical follow-through.
The one exception: extreme macro event days. On June 5 (NFP day), 100% of BULL setups failed. The rule we now use is: trade BULL counter-trend setups freely, but not on scheduled macro event days (NFP, CPI, FOMC).
BEAR setups show half the R of BULL setups. BEAR aligned averaged +0.635R vs BULL's +1.1R+. The scanner tracks both sides, but filtered BULL setups have consistently stronger expectancy regardless of market direction.
Low RVOL at close outperforms high RVOL
This one surprised us enough that we ran it three times before accepting the result.
| RVOL at Close | Triggered | TP1+ Rate | Breakout Rate |
|---|---|---|---|
| RVOL < 1.0 (quiet) | 45 | 44.4% | 68.9% |
| RVOL >= 1.0 (active) | 145 | 33.1% | 56.6% |
Low RVOL at close means the stock is trading quietly below its recent volume average. Most traders interpret that as weak: nothing happening, skip it. What the data shows is the opposite: quiet consolidation near a breakout level means the stock is coiling. Nobody is selling aggressively. The spring is compressed. When it breaks the next morning with fresh volume, the move has more room because the prior session didn't exhaust it.
High RVOL at close means the action already started. The breakout may have partially run. The next morning has less fuel. We stopped filtering for high RVOL at close because of this finding. The scanner tracks RVOL at the moment of breakout. That's where high volume is meaningful. At close, low RVOL is the signal.
The swing hold window: 1-3 days, then stop
For filter-pass setups that don't trigger on day 1, how long does the edge last?
| Hold Window | Resolved | Breakout % | TP3 Hits |
|---|---|---|---|
| Day 1 | 153 | 56.9% | 20 |
| Day 2 | 13 | 53.8% | 2 |
| Day 3 | 49 | 59.2% | 3 |
| Day 4-5 | 26 | 50.0% | 2 |
| Day 6-7 | 15 | 26.7% | 0 |
74% of all TP3 hits happen when the setup triggers on day 1. Day 3 has a secondary resolution spike: 49 setups with a 59.2% breakout rate, suggesting some setups need a few days to coil further before triggering. But by day 6, the failure rate hits 73% and TP3 hits drop to zero.
The optimal hold window is 1-3 trading days. After day 3 you're no longer holding a setup with an edge. You're holding a setup that probably already failed quietly. The Edge Lab bots follow a similar logic with their Xontra swing position management.
Six actionable takeaways from 60 days of data
- 01 Rank setups by profit factor at close. PF 3+ setups produced 75.7% win rate in the backtest and +0.748R per enter-at-close trade. PF is a ranking tool, not an automatic entry gate.
- 02 Prioritize AT BREAKOUT over ON WATCH. Being within 0.3% of the breakout level at close consistently outperforms 0.3-1.0% across all PF tiers. The closer the coil, the cleaner the trigger.
- 03 Enter between 9:30-10:00am. The 9:40-10:00am AT BREAKOUT window produces 61.3% TP1+ rate. After 10am the edge starts fading. After 2pm it disappears entirely.
- 04 Hard stop at 2pm. Zero TP1+ hits across 17 trades after 2pm. This is not a soft guideline. It's the clearest stop-trading signal in the entire dataset.
- 05 Take BULL setups on red days. BULL counter-trend setups averaged +1.114R with 63.3% win rate across 60 trades. The only exception is scheduled macro event days (NFP, CPI, FOMC).
- 06 Ignore RVOL at close. Low RVOL outperforms high RVOL (44.4% vs 33.1% TP1+ rate). Quiet consolidation near a breakout level is a coiling signal, not a weakness signal.
- 07 Hold 1-3 days maximum. 74% of TP3 hits happen on day 1. After day 3, failure rates climb and TP3 probability approaches zero. Cut the position and move on.
What this research doesn't tell you
60 days is a meaningful sample but not definitive. The enter-at-close R simulation uses next-day close price, not intraday exits. Actual TP1 trail exits could produce different R values in either direction. Weekend gaps are excluded, so Friday-to-Monday holds are untested. Some sub-groups have small sample sizes (PF 2-3 AT BREAKOUT had only 10 trades).
The 60-day window reflects a specific market regime. A prolonged bear market or high-volatility environment may produce materially different results. The profit factor rankings are based on the current scanner algorithm. Any algorithm change would require re-running the analysis. The 2pm cutoff finding, while clean, comes from 17 trades. We're collecting more data daily to validate it.
We're publishing the limitations because the edge is only useful if you trust the data, and you can only trust the data if you understand where it might be wrong.
Related pages
The filter described in this research runs live in the breakout scanner every 10 minutes. Bot performance using these same signals is tracked publicly in the track record. For a primer on the wedge patterns the scanner detects, see Wedge Patterns. For the sweet spot filter specifically, see The Sweet Spot.
The scanner that generated this data is live
200+ symbols. 30-minute timeframe. Profit factor rankings, proximity scores, and grade stability visible on every setup. Free tier available now.
Open the Live Scanner