May 4–8: 91 Breakouts, 178 Failures; Xcel Leads With 16 Trades
Scanner performance, bot report cards, and the Monday outlook for May 04 to May 08.
Week in Review
From May 04 to May 08, 2026, the tape produced a reasonable amount of scanner activity but weak conversion into high-quality realized outcomes. The scanner continued to find names near trigger levels, yet live bot execution struggled to capture follow-through, especially in short-dated options where time decay and poor early momentum quickly forced exits.
The broader message for the week is simple: signal generation was not the main problem. Execution quality, trade selection under tight time constraints, and filters that excluded some of the best movers were the larger sources of drag.
Scanner Scorecard
467 Total setups |
91 Breakouts |
19.5% Breakout rate |
178 Failures |
34 Expired |
164 Unresolved |
8 TP3 full runners |
16 TP2 and TP3 combined |
A 19.5% breakout rate is not strong enough on its own to support aggressive positioning, especially when 178 setups failed outright and another 164 remain unresolved. The scanner is still surfacing opportunity, but the hit rate suggests the environment was selective rather than broadly trending.
There were 24 setups that reached at least TP1, including 8 full runners to TP3. That runner count matters. It tells us the market still rewarded a small subset of names with real expansion, but the distribution was thin and uneven.
Grade quality remained heavily concentrated in the upper middle of the stack. Of 467 setups, 319 were A- or better, including 287 A-, 16 A, 15 A+, and 1 A++. Another 92 came in at B+, with only 56 at B. This is a quality-heavy scan output, which increases confidence in the model's ranking logic, but it also highlights a gap between scan quality and monetized execution.
The scanner generated enough high-grade ideas. The main issue was not idea scarcity. It was converting those ideas into trades that could survive the first 10 to 50 minutes of option pricing friction.
Bot Report Card
WEX
3 trades, 1 win, total return of -0.34R.
WEX had a small sample week, but the outcome was still negative. The best result was GOOGL BULL at +0.03R, which was technically positive but too small to matter. CSCO closed flat due to an orphaned trade with no Alpaca position found, which points to an operational reliability issue rather than a market read. The main drag was XLY BULL at -0.37R, exited after a rapid 36.8% option drawdown in just 20 minutes.
Pattern: when WEX was wrong, it was wrong quickly. There was little evidence of sustained edge this week, and one-third of its activity was compromised by trade handling issues.
XCEL
16 trades, 2 wins, total return of -1.34R.
XCEL was far more active and broadly unproductive. Most exits were GPT-directed due to weak early trade behavior, lack of traction, or immediate option decay. The system repeatedly entered names that were still structurally valid on the chart, but the options failed to accelerate fast enough to justify holding. This was especially visible in 0-DTE to 3-DTE contracts.
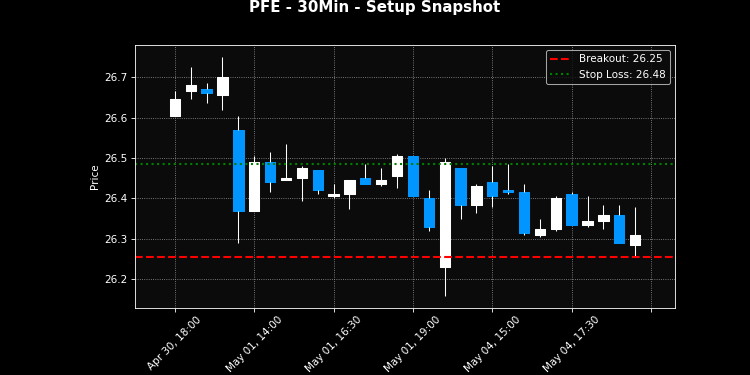
What worked: tactical damage control. Losses were generally kept in the -0.02R to -0.20R range, with only one deeper hit at -0.32R on MU. What did not work: conviction entries in short-duration contracts without immediate momentum confirmation. PFE alone appeared multiple times on the bear side with mostly small losses and one modest gain, which suggests overtrading the same theme without enough edge per attempt.
Pattern: XCEL correctly recognized when trades were not behaving, but too many entries never had enough initial force to overcome premium decay. That is a selection problem, not just an exit problem.
Combined bot performance was -1.68R across 19 trades. The systems did a decent job cutting losers, but they were not entering trades with enough immediate payoff potential to offset the steady stream of small losses.
Best and Worst
| Category | Bot | Ticker | Direction | Result |
|---|---|---|---|---|
| Best | Xcel | PFE | BEAR | +7.7% (+0.08R) |
| Best | Xcel | MARA | BULL | +5.9% (+0.06R) |
| Best | Wex | GOOGL | BULL | +2.8% (+0.03R) |
| Worst | Wex | XLY | BULL | -36.8% (-0.37R) |
| Worst | Xcel | MU | BULL | -31.7% (-0.32R) |
| Worst | Xcel | BIDU | BULL | -20.3% (-0.20R) |
The most telling part of this table is how small the winners were. The top three gains together added only +0.17R, while the top three losses subtracted -0.89R. That asymmetry is the week in one snapshot.
PFE BEAR was the cleanest monetized idea, but even that only produced +0.08R. MARA and GOOGL also worked in the narrow sense that they avoided losses, but they did not convert into meaningful wins. By contrast, XLY and MU show the cost of entering options that do not get instant sponsorship. Once these contracts slipped early, there was little room for recovery.
The practical read is that upside capture was too conservative or too brief, while downside was still material whenever timing missed by even a small margin.
Blind Spots
Two filters stood out as significant opportunity costs.
| Filter | Missed Trades | Estimated R Left on Table |
|---|---|---|
| rvol_threshold | 5 | +44.8R |
| day_pct_filter | 4 | +17.0R |
The relative volume threshold is the bigger issue by far. Missing 5 trades that collectively represented +44.8R implies the current RVOL gate may be too rigid or too context-blind. Some high-quality breakouts likely developed before volume looked exceptional on the surface, or they emerged in names where absolute volume mattered more than relative intraday expansion.
The day percent filter also deserves review. Leaving +17.0R behind across 4 trades suggests the system may be rejecting names that are already extended on the day but still have room for secondary expansion. In strong directional conditions, a name being up or down materially is often confirmation, not disqualification.
The data argues for filter refinement, not full removal. The goal should be conditional flexibility: loosen RVOL and day percent constraints when grade quality, proximity, and structure are strong enough to justify it.
Monday Outlook
The Monday coil list is balanced, with both bullish and bearish candidates near trigger levels. That matters because last week did not support broad directional assumptions. Traders should stay reactive and let the first real expansion decide the bias.
| Ticker | Grade | Direction | Priority | Distance from Level | RVOL |
|---|---|---|---|---|---|
| SLV | A- | BULL | 82 | 0.287% | 1.0x |
| TGT | A- | BEAR | 80 | 1.078% | 1.0x |
| ORCL | A- | BULL | 79 | 1.033% | 1.0x |
| XLE | A- | BEAR | 78 | 0.207% | 1.0x |
| MPC | A- | BULL | 77 | 1.174% | 1.0x |
| XLF | A- | BEAR | 77 | 0.176% | 0.19x |
| BMY | A- | BEAR | 77 | 0.232% | 1.0x |
| CAT | A | BULL | 77 | 1.893% | 1.0x |
| JNJ | A- | BEAR | 76 | 0.143% | 1.0x |
| IWM | A- | BULL | 76 | 0.27% | 1.0x |
Closest to actionable are JNJ BEAR, XLF BEAR, XLE BEAR, BMY BEAR, IWM BULL, and SLV BULL, all within roughly 0.30% of their levels. CAT is the highest grade on the list at A, but it sits nearly 1.9% away, so it is more of a watch candidate than an immediate trigger.
XLF deserves special caution. Its distance is attractive, but RVOL at 0.19x is extremely light. If volume does not improve, that signal may remain technically clean but practically difficult to monetize. In contrast, SLV, XLE, and JNJ combine decent proximity with more acceptable participation metrics and are cleaner candidates for early monitoring.
Key Takeaway
The scanner is still finding tradable structure, but until execution adapts to short-dated option decay and loosens the filters that blocked high-R outliers, the realized edge will continue to trail the underlying opportunity set.