May 11–15: 528 Setups, 144 Breakouts, Wex and Xcel Lead
Scanner performance, bot report cards, and the Monday outlook for May 11 to May 15.
For context, here is the May 4-8 weekly recap.
Week in Review
The tape stayed tradable, but not forgiving. Breakout participation was decent across the scanner, yet follow-through to larger targets remained limited, which is consistent with a market that rewards timing and risk control more than broad aggression.
The main takeaway from price behavior was selectivity. There were enough valid moves to keep the opportunity set healthy, but edge concentrated in a narrower band of names and sectors than raw setup volume might suggest.
Scanner Scorecard
528 Total setups |
144 Breakouts |
27.3% Breakout rate |
140 Failures |
238 Unresolved |
6 Expired |
20 A setups |
20 A+ and A++ setups |
The scanner produced 528 setups, with 144 breakouts for a 27.3% breakout rate. That is good enough to keep traders engaged, but not high enough to justify loose entries or broad chasing. Near any discussion of setup grades and breakout levels, the important point is that quality still matters more than quantity, and you can see live setups in the scanner to track how that quality is evolving in real time.
Grade quality skewed heavily toward the upper end. A-, A, A+, and A++ accounted for 380 of 528 setups, or roughly 72.0% of total flow. The distribution was A- 340, A 20, A+ 15, A++ 5, with B+ 97 and B 51. That concentration in A- rather than true top-tier A+/A++ tells an important story: the market offered many acceptable structures, but relatively few elite ones.
Target attainment was modest. Only 8 setups reached TP1, 6 reached TP2, and 6 became full TP3 runners. Relative to 144 breakouts, that implies a low conversion rate into meaningful trend extensions. The scanner found movement, but the market did not consistently reward holding for outsized continuation.
Bot Report Card
WEX 6 trades | 3 wins | +0.29R
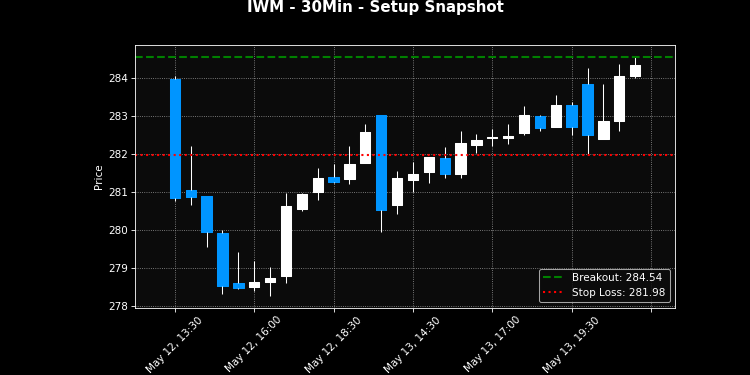
WEX finished positive, though the gain was small relative to the number of opportunities available. The strongest contributors were NVDA BULL at +0.11R and IWM BULL at +0.17R, while GS added only +0.02R before a stop loss exit. Three trades, XLP, WMT, and NKE, were orphaned with no Alpaca position found and recorded at 0.00R, which dampened the week and points to an execution integrity issue rather than a signal quality issue. If you want to track bot activity directly, you can watch the bots trade live in the Edge Lab.
What worked for WEX was participation in broad and liquid bullish themes. NVDA and IWM both showed the model can stay attached to strength long enough to extract some value, even if the final realized R remained conservative. What did not work was operational consistency. A positive week with three null trades leaves open the question of how much edge was actually captured versus simply preserved.
XCEL 5 trades | 1 win | -0.50R
XCEL had the weaker week. The largest drag was XLC BEAR at -0.47R on a hard stop, which accounted for almost the entire deficit. GLD BULL lost -0.10R despite reaching a +59% peak before giving back to a trailing floor, while QQQ BULL exited early at -0.01R. XLF BEAR was the lone meaningful winner at +0.09R. EA closed manually at 0.00R after an orphan-related failure, leaving the final P&L unknown. You can watch the bots trade live in the Edge Lab to monitor these execution and management patterns as they happen.
What worked for XCEL was the bearish expression in XLF, where the model captured downside continuation and protected gains. What failed was loss containment in XLC and profit retention in GLD. The GLD trade is especially instructive: a setup can be directionally right and still produce a net loss if the trailing logic gives back too much from peak excursion.
Combined bot result: 11 trades, 4 wins, -0.21R net. The strategy layer was mixed, but the larger issue this week was execution reliability and trade management asymmetry, not a total absence of signal.
Best and Worst
The best trade of the week was WEX IWM BULL at +16.8% and +0.17R. That matters because it came from a broad market proxy, suggesting the cleaner edge was often in liquid index-linked exposure rather than in idiosyncratic single-name breakouts. WEX NVDA BULL at +10.9% and +0.11R reinforced that point. Strong names still worked, but realized gains remained modest relative to gross move size, implying exits were protective rather than aggressive.
Xcel XLF BEAR at +8.6% and +0.09R was the best non-WEX result and likely the cleanest example of what the week rewarded: directional alignment, sector clarity, and manageable volatility. That is the kind of setup profile worth prioritizing when the broader market is producing breakouts without widespread trend persistence.
The worst trade was Xcel XLC BEAR at -47.4% and -0.47R. That single result overwhelmed the rest of XCEL's book. It is a reminder that hard stop placement can still be too permissive when options convexity is involved and the underlying does not move quickly enough in favor. GLD BULL was also notable because it reached a +59% peak and still finished at -0.10R. That is not a thesis problem. It is a trade management problem.
Blind Spots
| Pattern | Missed Trades | R Left on Table |
|---|---|---|
| spy_alignment | 8 | +18.6R |
| rvol_threshold | 5 | +14.7R |
| not_on_watchlist | 4 | +14.7R |
| day_pct_filter | 3 | +8.9R |
The largest blind spot was spy_alignment, with 8 missed trades and +18.6R left on the table. That suggests the current market regime may be producing valid moves that are less tightly synchronized with SPY than the filters expect. If the system requires too much index confirmation, it risks arriving late to sector or single-name leadership.
The next issue is rvol_threshold. Five missed trades worth +14.7R indicate the model may be over-penalizing quieter tape that still transitions into valid expansion. In a week where many setups were good but not explosive, demanding elevated relative volume may have filtered out exactly the kind of lower-noise breakout that can still perform.
Not_on_watchlist and day_pct_filter both point to the same structural problem: the framework is still too dependent on preselected attention and preset movement constraints. In a market with narrower but real opportunity, adaptive inclusion matters. The model is missing trades not because there are no setups, but because some of its assumptions about where opportunity should appear are too rigid.
Monday Outlook
The Monday list leans balanced, with both bullish and bearish candidates showing tight proximity to trigger levels. This is exactly the kind of environment where proximity matters more than prediction, and you can see live setups in the scanner as names move into actionable range.
| Ticker | Grade | Bias | P | Distance from Level | RVOL |
|---|---|---|---|---|---|
| APP | A- | BULL | 78 | 0.9981% | 1.0x |
| SOFI | A- | BEAR | 76 | 1.365% | 1.0x |
| TTWO | A- | BULL | 73 | 1.431% | 1.0x |
| SBUX | A- | BULL | 71 | 1.006% | 1.0x |
| WFC | A- | BEAR | 71 | 0.872% | 1.0x |
| RDDT | A- | BULL | 70 | 0.663% | 1.0x |
| XLF | A- | BEAR | 70 | -0.0784% | 1.0x |
| NFLX | A- | BEAR | 68 | 0.421% | 1.0x |
| ABBV | A- | BULL | 68 | 1.086% | 1.0x |
| GOOGL | A- | BULL | 67 | 0.7597% | 1.0x |
XLF stands out because it is already slightly through its level at -0.0784%, making it the most immediate test of whether financial weakness can persist into the new week. RDDT and NFLX are also close enough to matter early. On the bullish side, APP, SBUX, and GOOGL offer cleaner long watch candidates if the market opens constructive.
Given the week we just saw, the priority for Monday is not to expand the watchlist indiscriminately. It is to focus on names nearest to trigger, let price confirm, and avoid assuming that an A- setup will automatically produce multi-target follow-through. Again, for those breakout levels and setup grades, you can see live setups in the scanner.
Key Takeaway
The most important insight from May 11 to May 15 is that the market provided enough valid setups to trade, but the real edge came from disciplined selection and tighter execution, not from assuming broad breakout volume would translate into sustained trend.
For reference, you can revisit the May 4-8 weekly recap.