Choppy tape kept winners scarce as breakouts struggled to stick
Scanner performance, bot report cards, and the Monday outlook for October 12 to October 16.
Weekly Intelligence Digest
October 12 to October 16, 2026
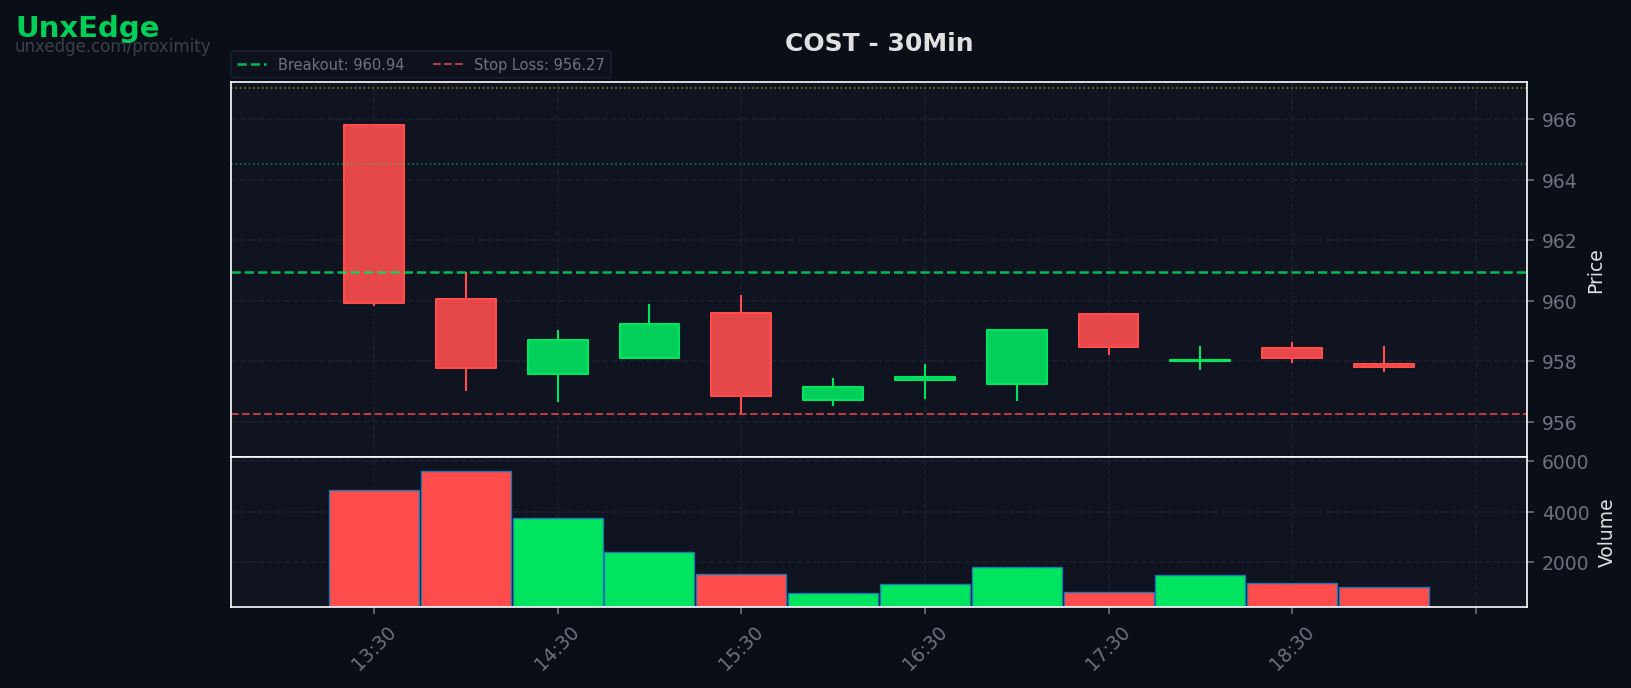
This week produced a large sample of scanner activity, but not a high-conviction tape. We saw 336 total setups with only 86 breakouts, while failures outnumbered confirmed moves, a sign that follow-through remained selective rather than broad. For context, here is the October 5-9 weekly recap.
Week in Review
Setup volume stayed active, but confirmation lagged
The scanner stayed busy across the week, yet the conversion rate from setup to breakout was modest at 25.6%. That matters because raw opportunity count can look healthy while actual tradable resolution remains thin.
The bigger message is quality dispersion. Most signals clustered in A- and B ranges, while true top-tier inventory remained scarce, which helps explain why the tape felt active without delivering many clean trend extensions.
Scanner Scorecard
Good breadth of setups, weak edge at the top of the stack
The scanner logged 336 setups, with 86 breakouts against 114 failures. That is a workable environment for selective traders, but not one that rewards broad aggression. If you are tracking setup grades or nearby breakout levels, see live setups in the scanner.
On the payoff side, only 3 setups reached full TP3 runner status, while 6 hit TP2 and 6 hit TP1. That distribution reinforces the same conclusion as the breakout rate: there was movement, but not much durable expansion. Grade quality also skewed lower. A- accounted for 125 setups, while only 15 setups were A or better, and just 5 were A+ or A++.
Bot Report Card
No participation is also information
WEX finished with 0 trades, 0 wins, and +0.00R. XCEL also logged 0 trades, 0 wins, and +0.00R. If you want to monitor bot execution and performance in real time, watch the bots trade live in the Edge Lab.
This was not a failure of deployment. It was a sign that the filters did not find enough qualifying structure to justify risk. In a week where failures exceeded breakouts and top-grade setups were limited, standing down preserved capital and avoided forcing entries into mediocre conditions.
What worked was restraint. What did not work was the broader market's ability to convert setup density into clean follow-through. The absence of trades suggests the current rule set is still prioritizing selectivity over activity, which is the correct bias in a tape like this.
Best and Worst
No standouts, which is the point
There were no best trades and no worst trades recorded this week. That can read as uneventful, but it is more useful to interpret it as a week with limited clean separation between excellent execution and obvious mistakes.
In practical terms, the edge was not concentrated enough to produce memorable outliers. When a week generates very few full runners and very few top-grade setups, the right takeaway is not that something was missed. It is that the market did not offer many exceptional windows to press.
Blind Spots
No missed-pattern data, but unresolved inventory remains the friction point
There was no missed trade pattern data this week, so there is no evidence of a specific recurring filter gap. That said, 127 unresolved setups is still the largest hidden cost in the report. It suggests many names approached actionable levels without delivering the decisive move needed for execution or post-trigger follow-through.
| Pattern | Missed Trades | R Left on Table |
|---|---|---|
| No data | 0 | +0R |
| No data | 0 | +0R |
The working hypothesis remains unchanged: the main blind spot is not missing explosive trades, but navigating a market that keeps many candidates near the line without resolving cleanly.
Monday Outlook
The watchlist is full, but the strongest pressure clusters lean mixed
Monday starts with a balanced list of bullish and bearish names coiling close to their levels. Several of the highest-pressure names are less than half a percent from trigger, which raises the odds of early tests if market conditions cooperate. For live setup grades and breakout proximity, see live setups in the scanner.