Breakouts led the week while sweet spot setups stayed selective
Backtest patterns, sweet spot performance, and missed-trade analysis for October 05 to October 09.
THE EDGE THIS WEEK
Participation Was Broad, Quality Was Not
This week showed a familiar split between strong symbol-level backtest outcomes and much weaker live scanner conversion. Across 189 symbols and 2,610 trades, the system still produced a 64.2% average win rate, but the live scanner only converted 20.4% of 421 setups into breakouts. The key pattern was selective trend follow-through: when leadership was clean, outcomes were exceptional, but broad setup volume did not translate into broad opportunity quality.
The second important pattern was regime inconsistency inside the setup window itself. The so-called sweet spot, defined by lower pressure and a 3 to 5 bar structure, underperformed sharply versus its own history, which suggests this week punished textbook compression and rewarded more specific, symbol-dependent strength instead.
BY THE NUMBERS
Weekly Performance Snapshot
The top-line data points to a market where opportunity existed, but only in narrower pockets than scanner activity alone would suggest. Backtest breadth remained healthy, yet live conversion lagged badly enough to warn against equating setup count with edge.
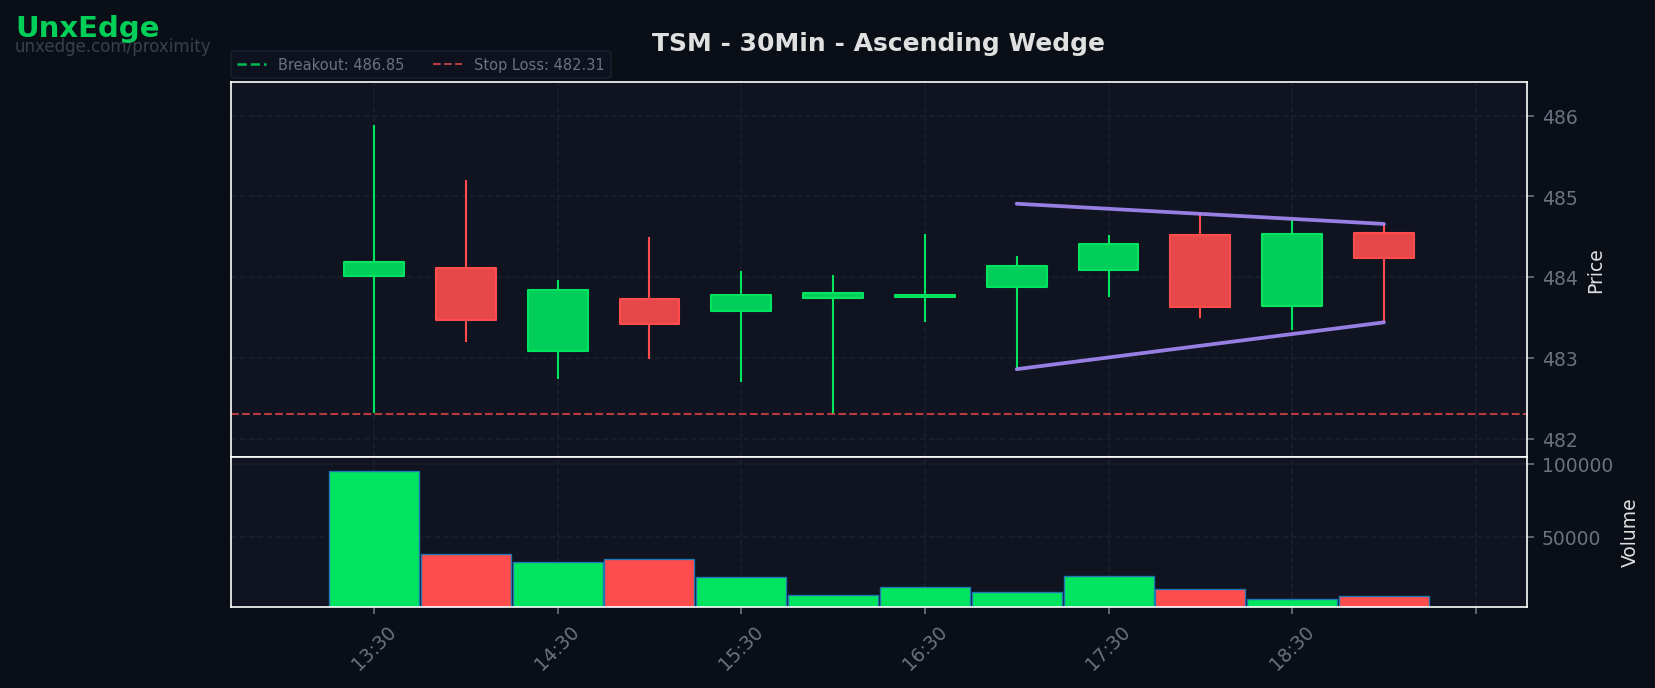
For traders reviewing current candidates, the practical takeaway is to tighten selection rather than increase participation. This was the kind of week where it paid to see live setups in the scanner and focus on concentration, not coverage.
SWEET SPOT REPORT
The Preferred Window Lost Its Usual Edge
3 to 5 Bars
The sweet spot underperformed by a wide margin this week, printing a 23.5% win rate versus a 54.9% historical baseline across 368 trades. That gap matters because it implies the issue was not random noise alone. A setup class that normally offers balanced entry structure and manageable risk failed to produce its usual follow-through.
The deeper interpretation is that low-pressure, short-base conditions were not enough by themselves. In stronger weeks, that profile can act as a reliable launching pad. This week, it appears to have attracted more premature entries than valid expansion moves. That suggests traders should not treat the sweet spot as a self-contained signal. It worked historically because of context, not because the pattern is universally durable.
When a historically strong setup degrades this sharply, the right response is not abandonment but filtration. The research question is which contextual inputs, sector strength, relative trend, or market participation, can restore the edge.
SYMBOL SPOTLIGHT
Where the Pattern Was Cleanest
NOW was one of the purest examples of alignment between consistency and payoff efficiency. It went 11 for 11 with a 0.9993 average R, which implies not only perfect win rate but highly stable outcome distribution. That is important because a 100% week with weak average expectancy can be misleading. Here, both hit rate and per-trade quality held together.
GDX stood out for a different reason. Its 95.45% win rate across 22 trades gives it more statistical weight than some of the smaller perfect records. This kind of result often points to persistent thematic sponsorship rather than isolated price action. The companion strength in GDXJ, which posted an 88.89% win rate across 18 trades, reinforces that interpretation.
COST deserves attention on the weak side. A 16.67% win rate across 12 trades with a -0.6669 average R signals repeated failure rather than one-off noise. When a symbol produces enough samples to matter and still cannot sustain the setup logic, that often indicates structural mismatch between the strategy and the name's short-term behavior.
The useful lesson is that symbol-specific character mattered more than generalized setup quality. This week rewarded traders who recognized where the pattern had traction and avoided assuming that success in one pocket would transfer cleanly elsewhere.
WHAT THE BOTS MISSED
No Slippage Between Signal and Execution
The execution layer did its job this week. No missed trades and no missed R means the gap between generated opportunity and captured opportunity was effectively zero. That is a meaningful result because it isolates the source of underperformance away from automation friction and back toward setup quality itself.
In other words, the problem was not that the bots failed to act. The problem was that many acted-on setups did not mature into valid breakouts. That distinction matters for anyone who wants to watch the bots in the Edge Lab. If the system is capturing everything and outcomes still weaken, the next iteration belongs in research and filtering, not execution logic.
SECTOR HEAT MAP
Leadership Was Concentrated, Not Universal
Breakouts were most concentrated in Technology with 30, far ahead of the next group. Consumer and Financials each contributed 8, while Healthcare and ETF exposure each added 7. Chinese ADR names produced 4 breakouts, enough to register as a niche pocket rather than a broad leadership lane.
There is some duplicate casing in the source data, with both Technology and technology, and both Consumer and consumer, appearing separately. Even without consolidation, the message is clear: sector participation was not evenly distributed. Technology dominated outright, and several secondary groups produced modest but not overwhelming follow-through.
This kind of distribution often leads traders into a common mistake. They see broad scanner activity and assume broad sector confirmation. The numbers argue the opposite. The week was driven by selective clusters, not uniform risk appetite. That means sector alignment likely mattered more than individual chart aesthetics.
RESEARCH NOTE
Setup Density Can Be a Negative Signal
One of the most useful insights from this week is that more setups did not create more edge. The scanner produced 421 setups, yet only 86 became breakouts and 150 failed. At the same time, several individual symbols delivered exceptional backtest behavior. This suggests that setup density may sometimes reflect unstable crowding rather than expanding opportunity.
For traders, the research implication is simple: treat elevated setup volume as a condition to investigate, not a reason to scale automatically. If setup count rises while conversion quality falls, the market may be advertising activity without offering clean continuation. The next step is to test whether sectors with concentrated follow-through, symbols with proven repeatability, or stricter context filters can separate abundance from actual edge.