NET Wedge Breakout Analysis
Live breakout scanner data · Updated every 10 minutes
A-
BULL
Technology · Cloud Infrastructure
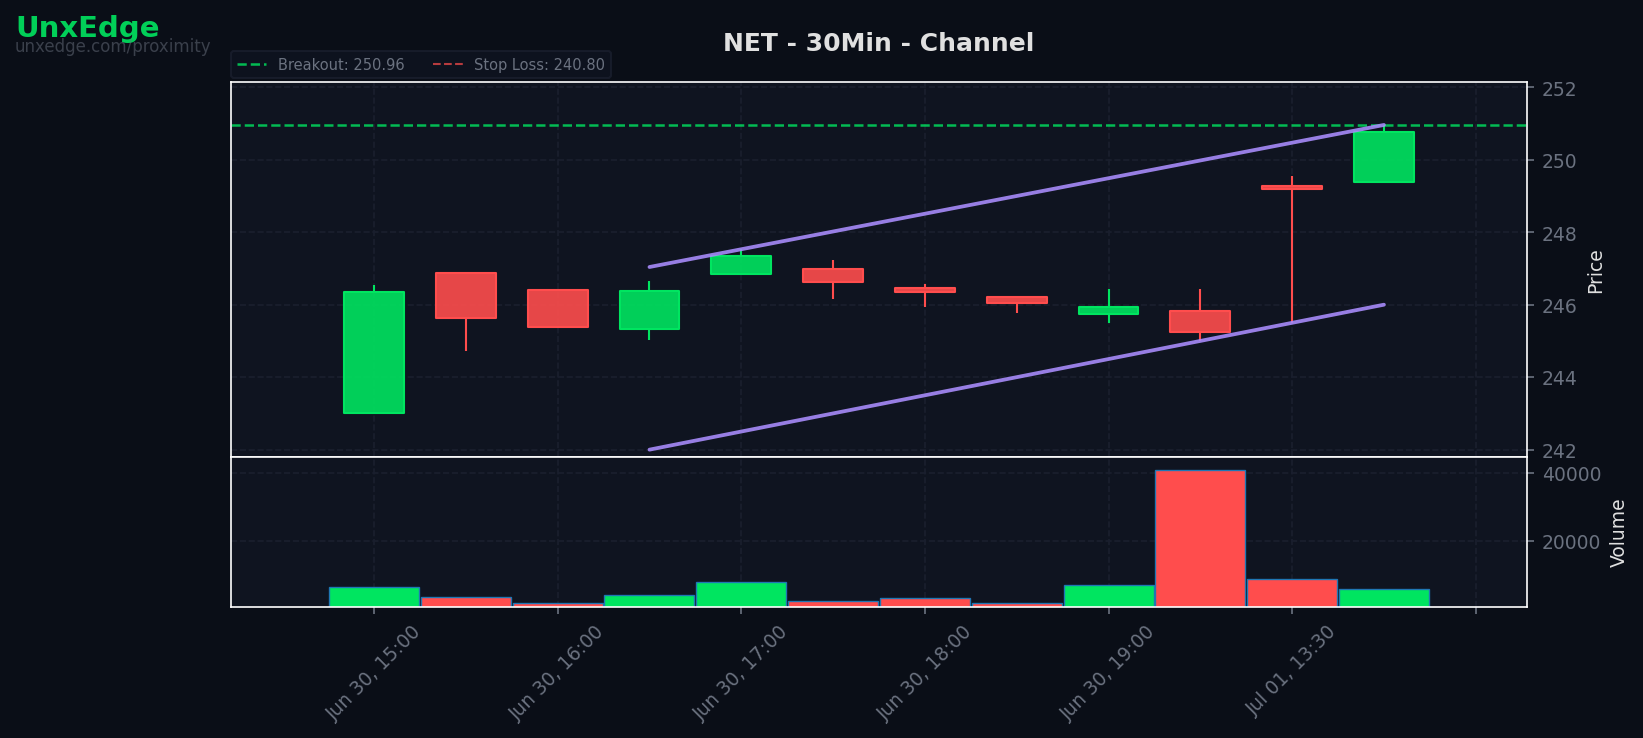
NET is currently showing a bullish wedge compression on the 30-minute timeframe, graded A- by the UnxEdge scanner. The current breakout level is $250.96, currently 1.83% away. This pattern has shown a 4.0x profit factor across 15 backtested trades.
Current Setup
Close$246.37 +1.53%
Breakout Level$250.96
Distance to Level1.83%
RVOL0.4×
Pressure54
PatternChannel
Trade Plan
Entry$251.86
Stop$249.71
TP1$254.01
TP2$256.16
TP3$258.31
Chart
Backtest Performance
Win Rate
80%
Profit Factor
4.00x
Avg R
+0.60R
Trades
15
Recent results
| Date | Side | Grade | Entry | Stop | Target | Exit | Result | R | Bars |
|---|---|---|---|---|---|---|---|---|---|
| Jun 24 | BEAR | A- | $221.49 | $223.63 | $219.35 | $219.35 | WIN | +1.00R | 3 |
| Jun 17 | BEAR | A- | $229.45 | $232.43 | $226.46 | $226.46 | WIN | +1.00R | 2 |
| Jun 4 | BULL | A- | $271.37 | $268.08 | $274.66 | $274.66 | WIN | +1.00R | 2 |
| May 12 | BEAR | A- | $188.84 | $191.46 | $186.21 | $186.21 | WIN | +1.00R | 12 |
| May 12 | BEAR | A- | $191.24 | $194.42 | $188.06 | $188.06 | WIN | +1.00R | 2 |
| May 7 | BULL | A- | $252.31 | $248.92 | $255.70 | $255.70 | WIN | +1.00R | 2 |
| May 5 | BULL | A- | $225.06 | $222.90 | $227.23 | $227.23 | WIN | +1.00R | 2 |
| Apr 21 | BULL | A- | $205.61 | $203.80 | $207.42 | $207.42 | WIN | +1.00R | 2 |
| Apr 7 | BULL | A- | $212.56 | $210.18 | $214.94 | $210.18 | LOSS | -1.00R | 3 |
Recent Setup History
| Date | Grade | Side | Breakout | Dist | Pressure | Resolution |
|---|---|---|---|---|---|---|
| 2026-07-01 | A- | BULL | $250.96 | 0.08% | 54 | — |
| 2026-07-01 | A- | BULL | $250.47 | 0.00% | 56 | — |
| 2026-07-01 | A- | BULL | $250.36 | 0.19% | 57 | — |
| 2026-07-01 | A- | BULL | $249.28 | 1.09% | 76 | — |
| 2026-07-01 | A- | BULL | $249.28 | 0.40% | 65 | — |
| 2026-07-01 | A | BULL | $247.53 | 0.92% | 76 | — |
| 2026-07-01 | A | BULL | $247.53 | 0.92% | 76 | — |
| 2026-07-01 | A | BULL | $247.53 | 0.92% | 76 | — |
| 2026-07-01 | A | BULL | $247.53 | 0.92% | 76 | — |
| 2026-06-30 | A | BULL | $247.53 | 0.93% | 76 | — |
Bot Activity
| Date | Side | Result | R | Exit |
|---|---|---|---|---|
| 2026-06-04 | BULL | — | — | ENTRY_REJECTED: price $274.37 already below stop $274.21 |
Other Active Breakout Setups
Earnings
Next Report2026-07-30 · TBD
Don't miss the next breakout
Subscribe to get real-time alerts when NET approaches its breakout level.
See pricing