Counter-trend setups stole the show in a choppy tape
Scanner performance, bot report cards, and the Monday outlook for June 01 to June 05.
Weekly Intelligence Digest
Week in Review
For June 01 to June 05, 2026, the tape stayed active enough to generate 408 scanner setups, but follow-through remained selective. The scanner found opportunities, yet only 26.0% resolved as breakouts while 117 failed, which tells us this was a week where timing and filter precision mattered more than raw idea count. For context, you can revisit the May 25-29 weekly recap.
The internal picture was mixed. There were only 8 high-grade A and A+/A++ setups combined, while most flow sat in A-, B+, and B territory, which helps explain why conviction was harder to convert into clean trend extension. The result was a market that offered tradable pockets, but not much margin for error.
Scanner Scorecard
Breadth was solid, but quality stayed thin at the top
The scanner produced a healthy 408 total setups with 106 breakouts and 117 failures. That 26.0% breakout rate is not disastrous, but it is not strong enough to support aggressive exposure without tighter selection. When setup grades and breakout levels matter this much, it makes sense to see live setups in the scanner.
Grade quality was the main constraint. A- setups dominated with 221 names, while only 5 were graded A and 3 were graded A+, which means the cleanest opportunities were scarce. On outcomes, the system logged 17 TP1 hits, 4 TP2 hits, and 7 TP3 full runners, showing that some names did trend, but the distribution was too narrow to lift the week broadly.
Bot Report Card
Execution stayed defensive, but the week still finished below breakeven
WEX took 4 trades and finished 0 wins with total performance of -1.21R. The losses were contained rather than catastrophic, but there was no offsetting winner to repair the week. $SOXS BEAR was the largest drawdown at -0.48R, while both $XHB BULL attempts failed to produce sustainable upside. $FTNT BULL also stopped out, reinforcing the same theme: entries were active, continuation was weak.
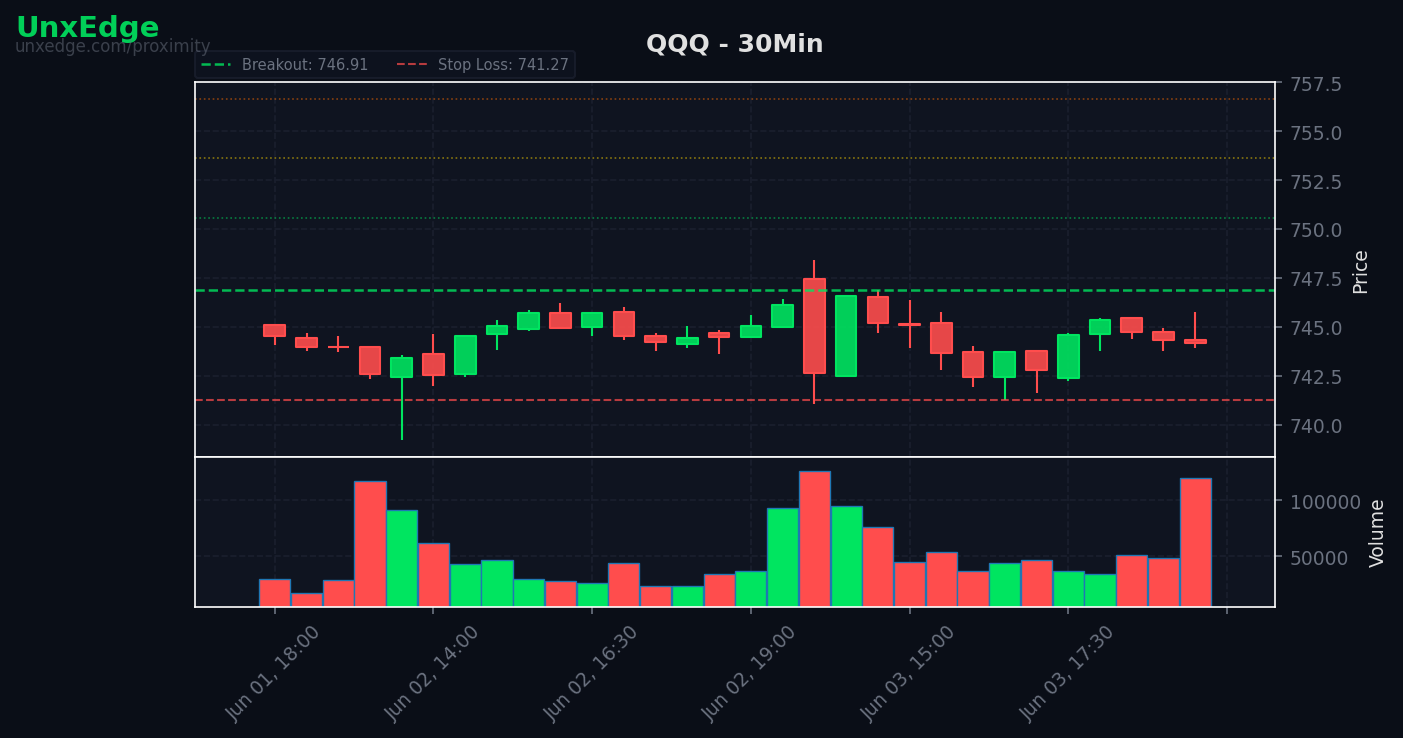
XCEL traded less and lost less. It took 2 $QQQ BULL trades, finishing 1 win and -0.25R total. The notable point is that the winning trade still only returned +0.07R after a trailing floor captured a small gain from a stronger intratrade peak. That is a sign the bot found direction, but not durable extension. If you want to review execution behavior and current performance, watch the bots trade live in the Edge Lab.
The pattern across both bots was consistent. Risk management worked better than signal monetization. Stops did their job, but upside conversion lagged because breakouts did not sustain often enough to pay for the attempts.
Best and Worst
The best trade barely made money, which says a lot about the week
The top trade was XCEL's $QQQ BULL at +0.07R. That is useful information because it highlights the ceiling the bots were dealing with. Even when direction was right, the market was not rewarding continuation with enough force to create meaningful R expansion.
The rest of the "best" list was still negative, with WEX $FTNT BULL at -0.20R and WEX $XHB BULL at -0.24R. In other words, the least bad trades were standing in for actual winners. That usually points to a market where participation is acceptable but payoff asymmetry is poor.
On the downside, WEX $SOXS BEAR at -0.48R was the weakest result, followed by XCEL $QQQ BULL at -0.32R and WEX $XHB BULL at -0.29R. None of these were catastrophic single-trade failures, which is encouraging, but the cluster of modest losses outweighed the very limited upside capture.
Blind Spots
The missed edge sat in filters, not in trade frequency
The biggest missed opportunities came from filter exclusions rather than lack of setup flow. The two major blind spots were spy_alignment and rvol_threshold, which together left 66.2R on the table across 27 missed trades. That is a large enough number to justify immediate review of how strict those gates should be under mixed market conditions.
The implication is straightforward. Some of the names that were filtered out still resolved well enough to matter, especially when broader tape conditions were inconsistent. This is exactly where reviewing live breakout candidates can help, so when levels and grades come up, it is worth using the tools to see live setups in the scanner.
| Pattern | Missed Trades | R Left on Table |
|---|---|---|
| rvol_threshold | 15 | +32.9R |
| spy_alignment | 12 | +33.3R |
| day_pct_filter | 1 | +2.8R |
Monday Outlook
Bearish pressure dominates the coil list, with one notable bullish exception
Heading into Monday, the watchlist is skewed bearish. $FDX leads with the highest pressure score at 78, followed by a single bullish outlier in $XLF at 77. The rest of the top names lean BEAR, which suggests traders should respect downside continuation if the market opens weak and these levels begin to trigger. For current grades and breakout proximity, you can see live setups in the scanner.
The most actionable point is concentration. This is not a broad balanced list. It is a downside-heavy coil set with names sitting relatively close to their levels and uniform 1.0x RVOL readings. That means confirmation will matter more than anticipation.