XBI Wedge Breakout Analysis
Live breakout scanner data · Updated every 10 minutes
B+
BULL
ETF · Biotech
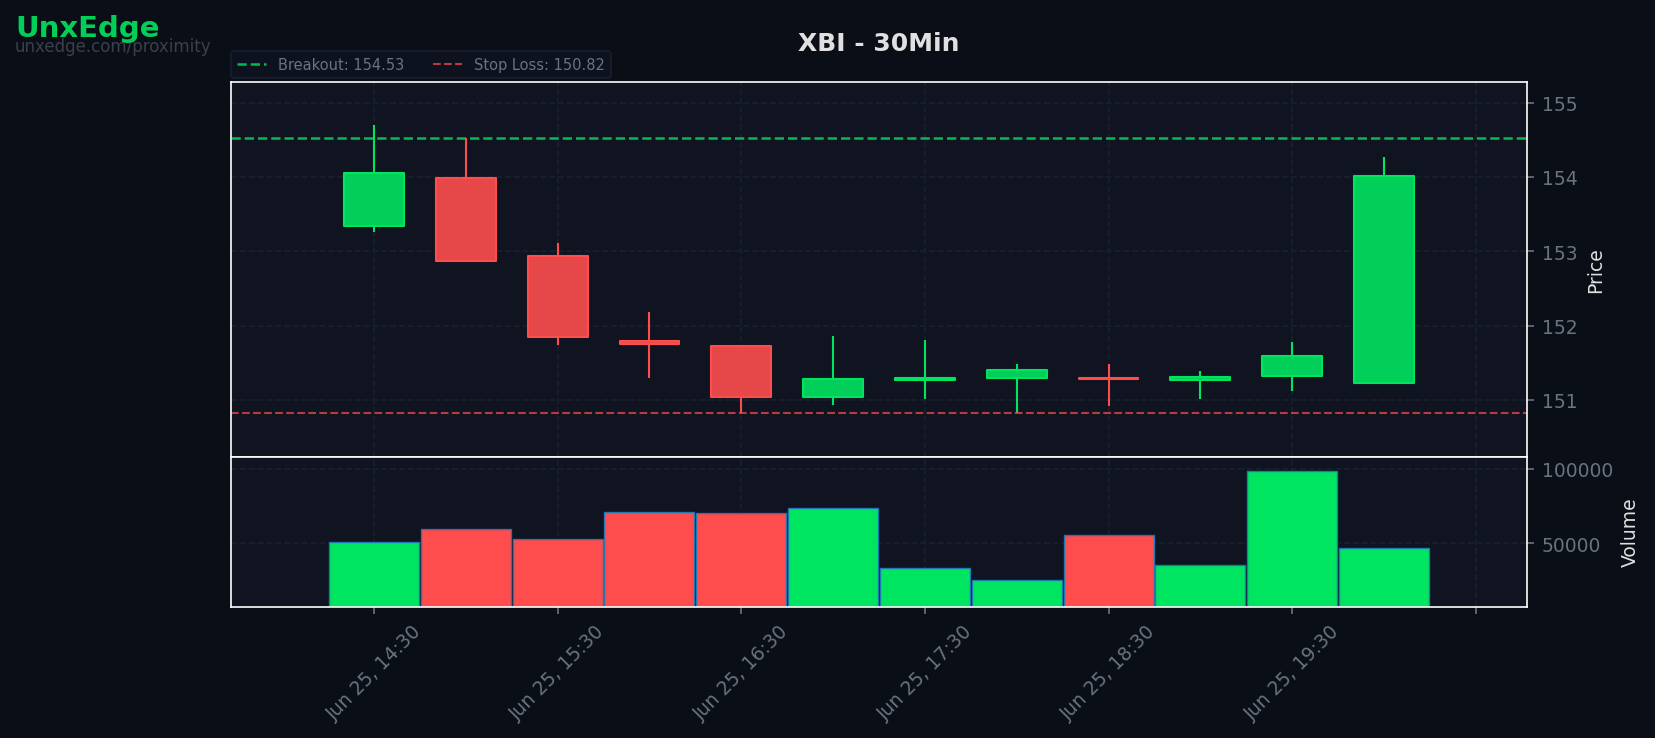
XBI is currently showing a bullish wedge compression on the 30-minute timeframe, graded B+ by the UnxEdge scanner. The current breakout level is $154.53, currently 0.27% away. This pattern has shown a 1.4x profit factor across 12 backtested trades.
Current Setup
Close$154.95 +3.26%
Breakout Level$154.53
Distance to Level0.27% (crossed)
RVOL0.5×
Pressure58
PatternCompression
Trade Plan
Entry$155.18
Stop$153.62
TP1$156.73
TP2$158.29
TP3$159.84
Chart
Backtest Performance
Win Rate
69%
Profit Factor
2.21x
Avg R
+0.38R
Trades
16
Recent results
| Date | Side | Grade | Entry | Stop | Target | Exit | Result | R | Bars |
|---|---|---|---|---|---|---|---|---|---|
| Jun 24 | BULL | A- | $150.17 | $148.89 | $151.46 | $151.46 | WIN | +1.01R | 5 |
| Jun 22 | BULL | A- | $141.64 | $140.49 | $142.78 | $142.78 | WIN | +0.99R | 2 |
| Jun 17 | BULL | A | $137.68 | $136.79 | $138.57 | $138.57 | WIN | +1.00R | 2 |
| May 27 | BULL | A- | $133.92 | $133.18 | $134.66 | $134.66 | WIN | +1.00R | 2 |
| May 13 | BULL | A- | $135.75 | $134.89 | $136.61 | $134.89 | LOSS | -1.00R | 4 |
| May 13 | BULL | A- | $135.74 | $134.90 | $136.57 | $134.90 | LOSS | -1.00R | 5 |
| May 11 | BULL | A- | $136.26 | $135.30 | $137.23 | $137.23 | WIN | +1.01R | 2 |
| May 6 | BULL | A- | $134.90 | $134.01 | $135.80 | $135.80 | WIN | +1.01R | 2 |
| Apr 6 | BULL | A- | $130.13 | $129.03 | $131.22 | $129.03 | LOSS | -1.00R | 8 |
Recent Setup History
| Date | Grade | Side | Breakout | Dist | Pressure | Resolution |
|---|---|---|---|---|---|---|
| 2026-06-26 | B+ | BULL | $154.53 | 0.17% | 58 | — |
| 2026-06-26 | B+ | BULL | $154.53 | 0.30% | 60 | — |
| 2026-06-26 | B+ | BULL | $154.53 | 0.82% | 63 | — |
| 2026-06-26 | B | BULL | $154.53 | 1.52% | 78 | — |
| 2026-06-24 | A- | BULL | $149.64 | 0.05% | 55 | breakout |
| 2026-06-24 | A- | BULL | $149.64 | 0.47% | 57 | — |
| 2026-06-24 | A- | BULL | $149.64 | 0.25% | 55 | — |
| 2026-06-24 | B+ | BULL | $149.10 | 0.15% | 60 | — |
| 2026-06-24 | B | BULL | $148.76 | 0.45% | 66 | — |
| 2026-06-24 | B | BULL | $148.76 | 1.20% | 74 | — |
Bot Activity
No bot trades on XBI yet.
Other Active Breakout Setups
Earnings
No upcoming earnings scheduled.
Don't miss the next breakout
Subscribe to get real-time alerts when XBI approaches its breakout level.
See pricing