XLI Wedge Breakout Analysis
Live breakout scanner data · Updated every 10 minutes
A-
BULL
ETF · Industrials
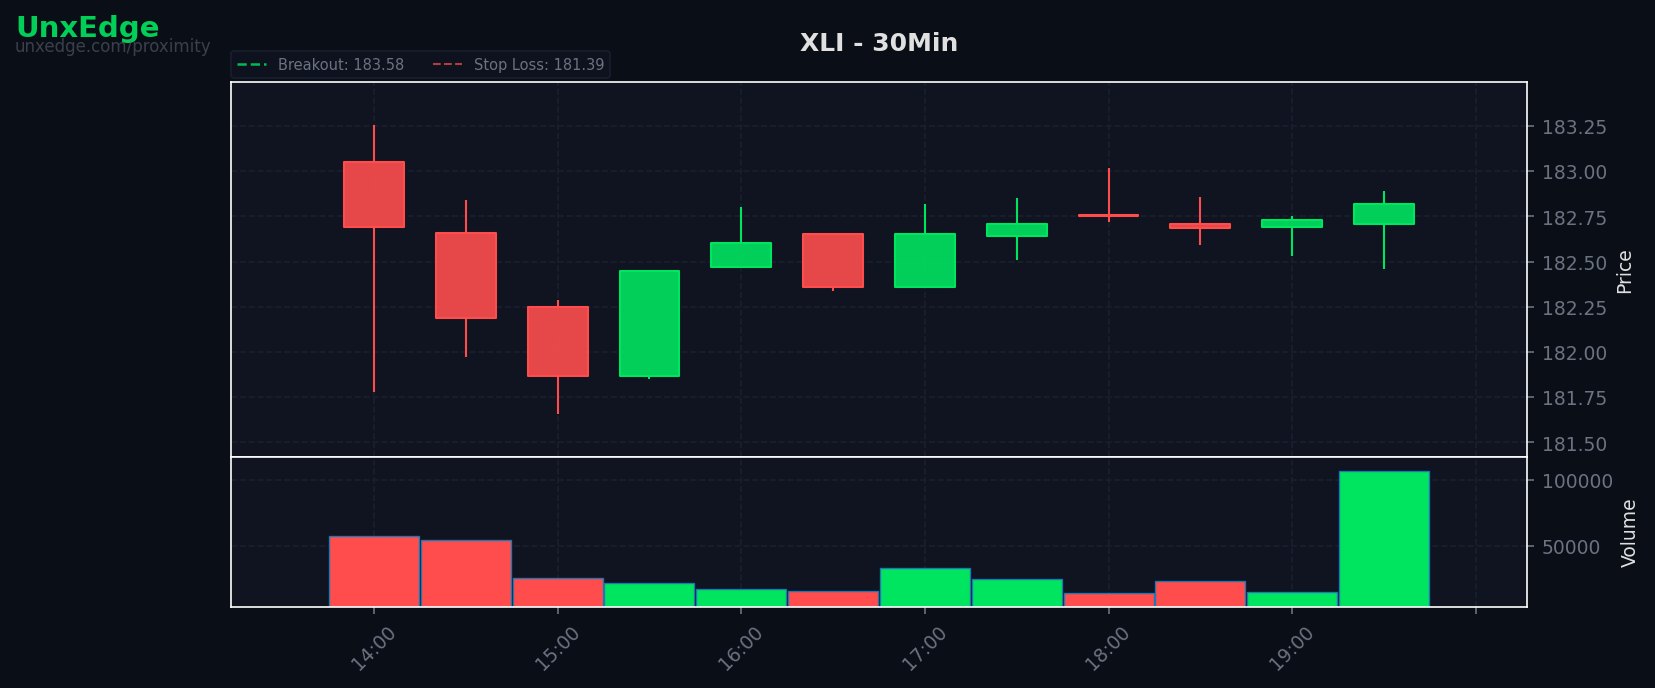
XLI is currently showing a bullish wedge compression on the 30-minute timeframe, graded A- by the UnxEdge scanner. The current breakout level is $183.58, currently 0.41% away. This pattern has shown a 0.7x profit factor across 5 backtested trades.
Current Setup
Close$182.82 +0.72%
Breakout Level$183.58
Distance to Level0.41%
RVOL1.0×
Pressure85
PatternCompression
Trade Plan
Entry$183.92
Stop$183.11
TP1$184.72
TP2$185.53
TP3$186.34
Chart
Backtest Performance
Win Rate
40%
Profit Factor
0.65x
Avg R
-0.21R
Trades
5
Recent results
| Date | Side | Grade | Entry | Stop | Target | Exit | Result | R | Bars |
|---|---|---|---|---|---|---|---|---|---|
| Jun 17 | BULL | A- | $181.92 | $181.34 | $182.51 | $181.34 | LOSS | -1.00R | 6 |
| Jun 17 | BULL | A- | $181.36 | $180.69 | $182.03 | $180.69 | LOSS | -1.00R | 2 |
| May 6 | BULL | A- | $173.28 | $172.73 | $173.82 | $173.82 | WIN | +0.98R | 2 |
| Apr 13 | BULL | A- | $172.76 | $172.23 | $173.29 | $172.23 | LOSS | -1.00R | 2 |
Recent Setup History
| Date | Grade | Side | Breakout | Dist | Pressure | Resolution |
|---|---|---|---|---|---|---|
| 2026-06-29 | A- | BULL | $183.58 | 0.41% | 85 | — |
| 2026-06-29 | A- | BULL | $183.58 | 0.41% | 85 | — |
| 2026-06-29 | A- | BULL | $183.58 | 0.41% | 85 | — |
| 2026-06-29 | A- | BULL | $183.58 | 0.41% | 85 | — |
| 2026-06-29 | A- | BULL | $183.58 | 0.41% | 85 | — |
| 2026-06-29 | A- | BULL | $183.58 | 0.41% | 85 | — |
| 2026-06-29 | A- | BULL | $183.58 | 0.49% | 94 | — |
| 2026-06-29 | B+ | BULL | $183.58 | 0.61% | 93 | — |
| 2026-06-29 | A- | BULL | $183.58 | 0.50% | 94 | — |
| 2026-06-29 | A- | BULL | $183.58 | 0.50% | 96 | — |
Bot Activity
No bot trades on XLI yet.
Other Active Breakout Setups
Earnings
No upcoming earnings scheduled.
Don't miss the next breakout
Subscribe to get real-time alerts when XLI approaches its breakout level.
See pricing