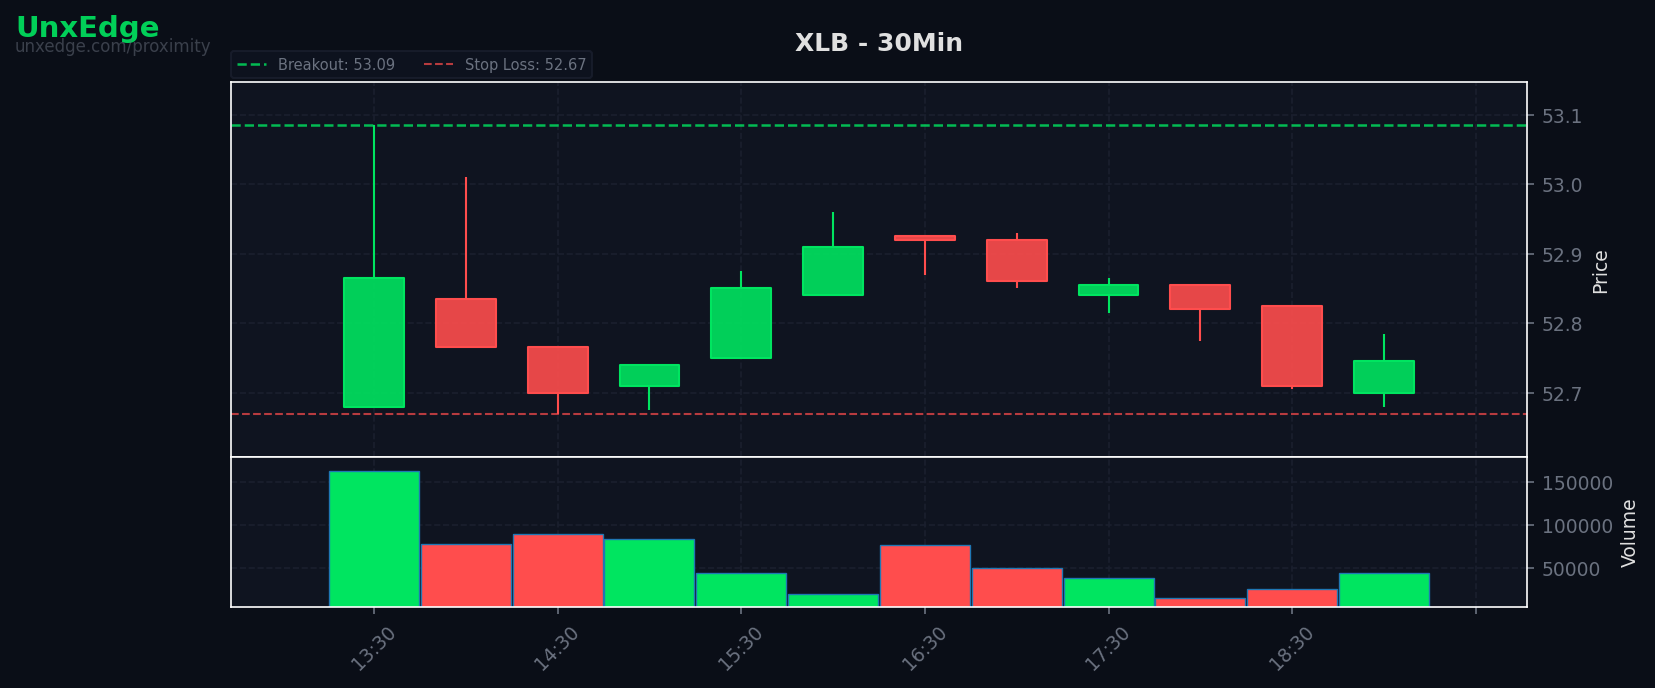
Breakouts led the week while sweet spot setups stayed selective
Backtest patterns, sweet spot performance, and missed-trade analysis for June 15 to June 19.
THE EDGE THIS WEEK
Follow-through was selective, not broad
This week’s data points to a market where opportunity existed, but only in narrow pockets with clean continuation characteristics. The strongest names converted at very high rates, while a meaningful cluster of symbols repeatedly failed, suggesting that symbol selection mattered more than raw setup frequency.
The scanner also showed a clear imbalance between attempts and successful expansion. With 403 setups producing just 69 breakouts, the dominant pattern was failed initiation rather than durable trend ignition, which helps explain why broad sweet spot conditions underperformed their historical baseline.
BY THE NUMBERS
Core backtest and scanner metrics
The headline contrast is straightforward: backtest win rates remained healthy at the portfolio level, but live scanner conversion was weak. That usually signals an environment where edge still exists in the right names and structures, but broad deployment without tighter filters leads to too much exposure to failed starts.
When average win rate stays strong while breakout rate compresses, the edge is likely becoming more concentrated. Traders should expect fewer valid expansions and place more weight on symbol-specific behavior than on market-wide participation.
SWEET SPOT REPORT
The preferred setup profile lost its usual efficiency
The sweet spot setup, defined by lower pressure and a 3 to 5 bar structure, materially underperformed its historical baseline. A 34.5% weekly win rate versus 57.9% historically suggests that the market was less rewarding to balanced, orderly setups and more dependent on context that this definition does not fully capture.
In practical terms, this means the usual compression-to-expansion rhythm was less reliable. Setups that would normally benefit from controlled pressure likely encountered either weak demand after trigger or insufficient directional sponsorship. Traders should treat this as a signal to validate the surrounding tape more carefully rather than assuming a favorable structure is enough on its own.
If you are tracking these conditions in real time, see live setups in the scanner.
A weak week for the sweet spot does not automatically invalidate the model. It often means the market shifted from rewarding clean structure to rewarding only the strongest relative strength pockets.
SYMBOL SPOTLIGHT
Where the pattern was clearest
GDX stands out as one of the most important signals in the dataset. Its 100% win rate across 14 trades, paired with roughly 1R average return, suggests repeated clean execution rather than a one-off anomaly. When an ETF posts perfect conversion across a larger sample, it often reflects durable thematic alignment rather than isolated stock-level noise.
PANW offers a different but equally useful read. At 92.86% win rate over 14 trades with 0.8573 average R, it shows that strong institutional trend names continued to reward participation even as broad breakout efficiency weakened. This reinforces the idea that leadership was still tradable, but mostly when momentum and sponsorship were already established.
DIS is the counterexample that helps explain the week. It appeared among the most active scanner names with 7 setups, yet also landed among the worst backtest performers at 33.33% win rate over 9 trades. That combination usually signals churn: plenty of opportunity on paper, but poor net conversion because repeated triggers lacked sustained follow-through.
This is the core lesson from the symbol data. Activity alone was not edge. Repetition in the right symbols worked. Repetition in unstable symbols compounded failure.
WHAT THE BOTS MISSED
Filter protection came at a real opportunity cost
The missed trade profile is notable because the cost was not just a handful of modest winners. Fifteen missed trades accounted for +55.3R, and 9 of them reached TP3 runner territory. That tells us the blocked trades were skewed toward outsized payoff opportunities rather than routine marginal setups.
The main blocker was rvol_threshold, responsible for 13 of the 15 misses, with spy_alignment accounting for the other 2. This suggests the system was conservative in a week where some valid breakouts emerged without the level of relative volume normally required for confirmation. In other words, the filter likely did its job in suppressing noise broadly, but it also excluded a subset of lower-volume initiations that later developed into meaningful moves.
The key research question is not whether the filter is bad. It is whether the threshold should adapt when breakout participation is narrow and edge is concentrated in only a few symbols. That is where incremental tuning could matter most. To study that behavior live, watch the bots in the Edge Lab.
Missed opportunity was concentrated, not random. When a small number of blocked trades account for large R potential, the next step is threshold calibration, not wholesale filter removal.
SECTOR HEAT MAP
Breakouts clustered in leadership groups
Breakouts were concentrated most heavily in Technology, with Energy and Financials forming the secondary layer of participation. That kind of distribution supports the broader conclusion that this was a leadership-driven tape, where edge came from staying close to sectors already proving they could generate expansion.
The duplicate capitalization in sector labels also hints at a classification issue in the raw data, especially with Technology and Consumer. Even with that noise, the directional message remains intact: breakouts were not evenly distributed, and traders were better served by focusing on concentrated sector leadership than by treating all groups as equally fertile.
RESEARCH NOTE
Low breakout rates can still coexist with strong symbol-level edge
The most useful insight from this week is that weak aggregate breakout conversion does not necessarily mean the strategy environment is broken. It may simply mean the edge has narrowed. This week had a 17.1% breakout rate in the scanner, yet multiple symbols delivered exceptional backtest performance, including a 100% club led by GDX, ELF, LLY, COIN, and URI.
That distinction matters for process. In a broad, healthy tape, setup quality alone can do more of the work. In a narrow tape, setup quality must be paired with symbol leadership, sector concentration, and a willingness to avoid high-activity names that are repeatedly failing. The research implication is clear: when scanner-wide conversion drops, the model should likely increase the importance of relative strength persistence and reduce reliance on generalized trigger frequency.
For traders, the practical takeaway is simple. Do not respond to a narrow market by abandoning breakout logic entirely. Respond by becoming more selective about where that logic is allowed to operate.