Breakouts led the week while the sweet spot stayed selective
Backtest patterns, sweet spot performance, and missed-trade analysis for October 12 to October 16.
THE EDGE THIS WEEK
Follow-through was selective, not broad
This week’s research points to a market where edge existed, but only in narrower pockets of alignment. The backtest remained healthy at a 64.2% average win rate across 2,610 trades, yet the live scanner breakout rate fell to 25.6%, which suggests that historical edge still rewarded the right structures while current conditions produced less reliable immediate expansion.
The dominant pattern was dispersion. A small group of symbols and sectors converted exceptionally well, while weaker areas failed quickly or chopped out, indicating that traders were better served by prioritizing symbol-level quality over broad participation assumptions.
BY THE NUMBERS
Weekly statistical baseline
The main tension in the data is the gap between broad backtest quality and weaker live scanner conversion. That combination often appears when the market still contains tradable trend fragments, but timing becomes less forgiving and breadth thins out. In practical terms, this usually favors tighter selection criteria, smaller initial expectations on first expansion, and closer attention to whether setups are appearing in symbols with recent evidence of clean follow-through.
When total system win rate stays constructive but scanner breakout rate drops, the edge is usually becoming more dependent on context. Selection matters more than signal count.
SWEET SPOT REPORT
The low-pressure window underperformed its long-term profile
The sweet spot cohort, defined as pressure below 60 with 3 to 5 bars, posted a 48.3% win rate this week versus a 55.5% historical baseline across 375 trades. That underperformance matters because this setup family is typically where traders expect cleaner early-stage expansion. Instead, this week it behaved more like a neutral-to-fragile continuation environment.
That suggests low pressure alone was not enough. In weeks where this profile lags its own history, the usual explanation is that compression exists without strong sponsorship. Setups may look orderly, but without enough directional commitment they break, stall, or mean revert before delivering full extension. Traders looking to see live setups in the scanner should read that as a reminder to stack additional filters around relative strength, sector leadership, and recent symbol-specific breakout behavior rather than treating the sweet spot definition as sufficient by itself.
Research-wise, this is a useful warning signal. If a normally reliable substructure underperforms while the broader backtest remains solid, it often means the edge has shifted from passive pattern quality toward more active contextual discrimination.
SYMBOL SPOTLIGHT
Three symbols that illustrate the week’s pattern structure
NOW stands out less because of its 100% win rate over 11 trades and more because of how closely its average R stayed to 1.0. That combination usually reflects efficient continuation behavior with limited slippage between trigger quality and reward capture. It is the profile of a symbol where the system did not need outlier runners to perform. Consistency, not variance, drove the result.
GDX is equally important. With a 95.45% win rate across 22 trades and 0.9097 average R, it offered both sample size and quality. When an ETF produces that level of repeated success, it often signals that the underlying group is rotating as a cohesive pocket rather than depending on one stock-specific catalyst. That makes $GDX one of the stronger examples of concentration working better than broad market participation.
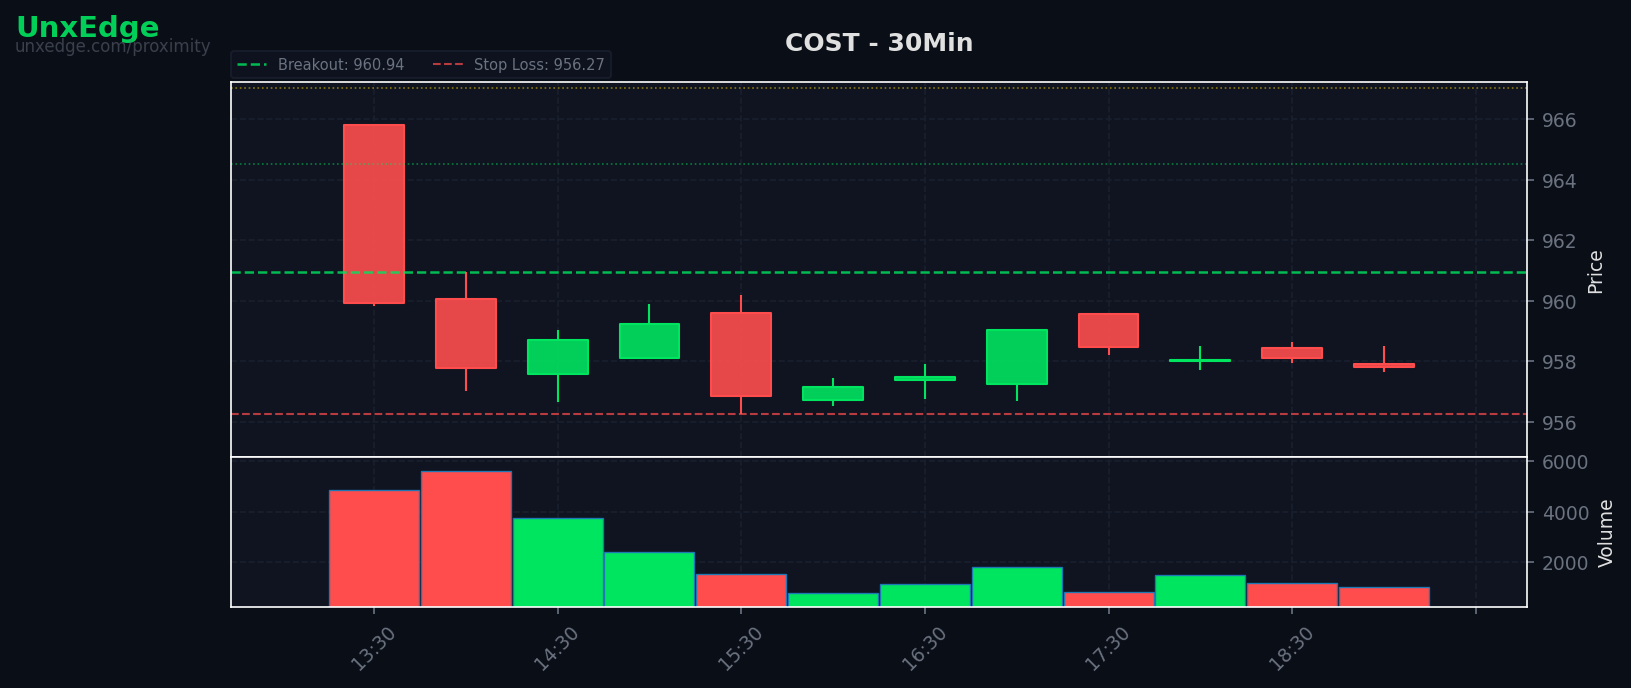
COST provides the opposite lesson. A 16.67% win rate across 12 trades with a -0.6669 average R suggests repeated failure rather than one bad sequence. This is the pattern traders need to study carefully: high-quality names can still become low-quality setups if timing conditions are wrong. The issue was likely not symbol reputation but repeated inability to sustain breakout acceptance.
Among the 100% club, LLY and CVX reinforce the same theme. This was not a week where strength was uniformly distributed. It clustered in symbols with clearer sponsorship and more reliable post-trigger behavior.
The best symbols this week did not just win often. They converted near a full R on average, which implies that clean execution and clean structure aligned at the same time.
WHAT THE BOTS MISSED
No opportunity leakage, but that does not mean no opportunity cost
The bots missed no trades this week, left no measurable R on the table, and did not block any TP3 runners. Operationally, that is a strong result. It means the system participated in what it was designed to capture and that underperformance in live breakouts cannot be blamed on execution leakage or over-restrictive filters.
That distinction matters. If the bots are fully participating and results are still mixed, the research focus should shift away from access problems and toward environment quality. In other words, the question becomes whether the market is producing enough valid expansion after entry, not whether the system is finding the entries. Traders can watch the bots in the Edge Lab with that framing in mind.
One implication is that adding looser filters would probably not have improved outcomes this week. In a low-conversion environment, more participation often increases exposure to weak breakouts rather than improving expectancy.
SECTOR HEAT MAP
Breakouts concentrated in targeted groups
Breakout concentration was led by ETFs with 19, followed by Technology with 16 and Healthcare with 11. Consumer posted 8, Energy 5, Financials 4, Industrials 4, and an additional consumer grouping showed 4, which further supports the idea that select discretionary activity was present but not dominant.
The key pattern here is layered leadership rather than synchronized leadership. ETFs leading the count can mean traders were finding cleaner expression through baskets than through individual names, which often happens when themes are present but stock selection is uneven. Technology and Healthcare still supplied meaningful breakout volume, but not at a level that implies universal trend ease.
Energy’s lower raw count becomes more interesting when viewed alongside the perfect performance in CVX. That tells us participation inside the sector was narrower than the index label alone would suggest. Similarly, broad counts in Technology did not prevent individual laggards from breaking down in quality, which is why symbol-level confirmation remained critical.
The most active scanner names, including $MPC, $BIDU, $CEG, $JD, $MRVL, $NKE, $PFE, $PSX, $SOXL, and $XBI, also fit this fragmented map. Activity was present, but not all activity was equal. In these conditions, repeated appearances should be treated as a prompt for deeper validation, not as proof of edge by themselves.
RESEARCH NOTE
When the historical edge is intact but the live breakout rate is weak
This week offers a useful framework for traders: a system can remain statistically sound while the immediate breakout environment becomes less efficient. The backtest average win rate of 64.2% says the underlying playbook still works across enough symbols and enough samples. The 25.6% live breakout rate says current triggers are producing far less broad confirmation in real time.
The research question, then, is not whether the strategy works. It is where the strategy still works best when market acceptance becomes selective. Weeks like this reward traders who rank setups by layered evidence: symbol consistency, sector concentration, recent breakout survival, and whether the setup belongs to a subgroup that is holding its long-term expectancy. This week, the sweet spot subgroup did not.
For next-week planning, the strongest adaptation is not to abandon breakout logic but to demand better proof before sizing up. If live conversion remains weak while top symbols continue to post elite numbers, the market is likely favoring concentrated deployment over broad signal participation.